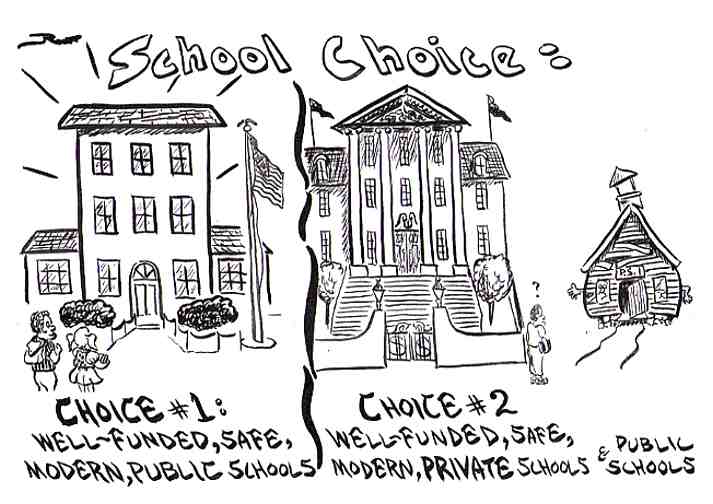
The public and private school debate has elevated in Australia.
While choice has always been part of Australian schooling, governments of all political hues have been enhancing their commitment to educational choice by increasing funding to the non-government sector (Forsey, Davies, & Walford, 2008).
The Australian Minister of Higher Education has spearheaded a project spending $3 million on research and creating a website “Myschool” that uses national standardized tests to compare performance of socio-economically and demographically similar schools across the country. Any parent and community member can now search and compare profiles of almost 9,500 Australian schools.
The launch of the website has raised several major issues regarding the private versus public debate in the field of education, questioning sociocultural ideology behind school ‘choice.’
There are several issues not only with school choice but also with how the website goes about comparing such schools. Forsey et al. (2008) note several reasons for why parents find ‘school choice’ so crucial. The first is self-segregation (a trend of a specific population group trying to separate itself for self-interest) – otherwise known as ‘white flight.’ It often results in wealthier families self-segregating themselves in better performing schools. Other reasons include higher level of placement testing (schools with higher average of standardized test scores) and concerted cultivation (parent expectations for structure and child-rearing support through the education system.)
It would appear that the government run website has embraced these facts, stating specifically that its purpose is to “locate statistical and contextual information about schools in your community and compare them with statistically similar schools across the country.”
How does the website compare such schools? This is where more problems arise…
The website compares the socio-economical background with the schools performance in ‘NAPLAN’ testing. The socio-economical status is judged by examining family background information provided to schools directly by families, including parental occupation, and the school education and non-school education levels they achieved. In some cases, where this information is not available, ICSEA uses Australian Bureau of Statistics (ABS) Census data on family background to determine a set of average family characteristics for the districts where students live. Where as the NAPLAN is based on two subjects (literacy and numeracy) and includes 40 questions. NAPLAN collects data on a national level every two years and it forgoes arts, science, health, music and the ability to function as a part of the community. It thus reflects an extremely narrow conceptualization of the broader purposes of schooling.
Another controversial point is about the use of the data on the school background (ICSEA), i.e. where the school sits on the socio-economic scale. The website shows whether a particular school is doing better, worse or about the same as schools that are statistically similar in their demographic group. In a way, it is directly naming and shaming Australian public schools and specifically singling out those in the lower socio-economic areas.
Another related and highly contested issue is the use of public funds in the private sector. The below numbers, which are taken directly from the website, reveal the funding of one of the most elite private schools in Sydney compared to one of the low-achieving public schools. When looking at the below charts, on the surface, a reader would notice both some discrepancy in the amount of money spent per student and unbelievably different academic results.
| Private: Sydney Church of England Grammar School, North Sydney, NSW |
| |
Total |
Per Child |
| Federal Funding |
$2,593,487 |
$1,644 |
| State Funding |
$1,747,072 |
$1,107 |
| School Fees |
$33,278,400 |
$21,089 |
| Total (including deductions) |
$34,134,46 |
$ 21,631 |
| Public: Chifley College Shalvey Campus, Shalvey NSW |
| |
Total |
Per Child |
| Federal Funding |
$1,235,638 |
$3,051 |
| State Funding |
$5,469,505 |
$13,505 |
| School Fees |
$81,221 |
$201 |
| Total (including deductions) |
$6,843,842 |
$16,898 |
This can’t be all there is to education. Money in, against scores out.
The short-sightedness of comparing the scores of the wealthy private scores against the low socio-economic means we’ve already given up on the majority of our population in such areas.
But our seemingly poor scoring low socio-economic schools do so much more. Let’s for a second forget that these kids may have less educated parents or less resources at home to help bolster scores. Schools for these students are more than just a place to memorize grammar and mathematical equations. Shalvey School (listed above) offers home cooking skills (whether for the students or their family), fitness classes, healthy cooking classes, getting kids involved with club sports, Smith Family I-track program for 20-30 students being mentored online from business people in the community about goal setting and personal development, University of Western Sydney student mentoring with pathway, Impact club for outdoor, home handy man and film course, learning grounds program for Aboriginal students focusing on number and literacy development, classes for women to make prom dresses while learning about community issues.
The school also offers classes for parents on how to use of computers, help students with homework, use numbers around the house, and improve literacy.
These schools are making communities stronger, they are making communities safer and maybe, just maybe (although not in standardized tests) they are making these communities smarter.
________________________________
*Forsey, M., Davies, S. & Walford, G. (2008). The globalization on school choice? An introduction to key issues and concerns. In M. Forsey, S. Davies, & G. Walford (Eds.), The globalization of school choice? (pp. 9-26). Oxford: Symposium Books.